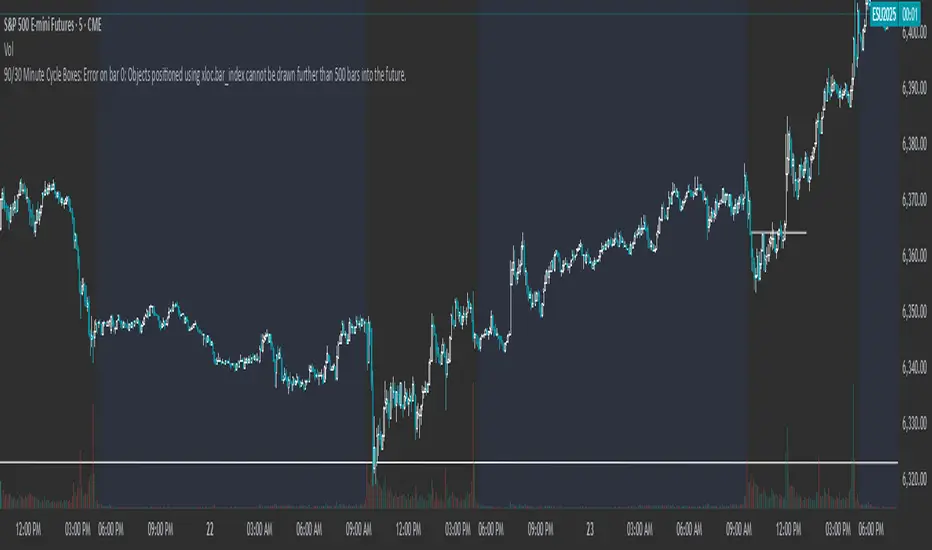
90/30 Minute Cycle BoxesThis indicator automatically draws time-based cycle boxes to help visualize market structure and cyclical behavior.
Features:
90-Minute Primary Cycles: Highlights each 90-minute interval with a colored box, showing the high and low of that period.
30-Minute Sub-Cycles: Each 90-minute box is divided into 3 sub-boxes representing 30-minute phases.
Multi-Timeframe Compatible: Works on all timeframes, adapting dynamically to your chart.
Visual Clarity: Alternating box colors make it easy to track price action within and across cycles.
This tool is ideal for traders who use time cycles in their analysis, especially those applying ICT, Smart Money Concepts, or time-based market theories.
"smart money"に関するスクリプトを検索
Midnight 30min High/LowMidnight 30min High/Low — Overnight Liquidity Range Tracker
Capture the Overnight Session: A Strategic Level Identification Tool from Professional Trading Methodology
This indicator captures the high and low prices during the critical 30-minute midnight session (12:00-12:30 AM EST) and projects these levels forward as key support and resistance zones. These overnight ranges often contain significant liquidity and serve as crucial reference points for intraday price action, representing areas where institutional activity may have established important levels.
🔍 What This Script Does:
Identifies Critical Overnight Session Levels
- Automatically detects the 12:00-12:30 AM EST session window
- Captures the highest and lowest prices during this 30-minute period
- Projects these levels forward for multiple trading days
Creates Dynamic Support/Resistance Zones
- Extends midnight high/low levels as horizontal lines with customizable projection periods
- Fills the area between high and low to create a visual trading range
- Updates automatically each trading day with new overnight levels
Provides Clear Visual Reference Points
- Optional session start markers (●) highlight when the midnight session begins
- Color-coded lines distinguish between high and low levels
- Transparent fill area creates an easy-to-identify trading zone
Real-Time Level Tracking
- Updates levels in real-time during the active midnight session
- Maintains historical levels for reference and backtesting
- Compatible with data window for precise level values
⚙️ Customization Options:
Extend Days (1-30):** Control how many days forward the levels are projected (default: 5 days)
High Line Color:** Customize the midnight high line color (default: blue)
Low Line Color:** Customize the midnight low line color (default: orange)
Fill Color:** Adjust the transparency and color of the range area (default: light aqua, 80% transparency)
Show Session Markers:** Toggle yellow session start indicators on/off (default: enabled)
💡 How to Use:
Deploy on lower timeframes (1m-15m) for precise level identification and reaction monitoring**
Watch for key price interactions:
- Rejection at midnight high levels (potential resistance)
- Bounce from midnight low levels (potential support)
- Range-bound trading between the high and low levels
Combine with liquidity concepts:
- Monitor for stop hunts above/below these levels
- Look for false breakouts that snap back into the range
- Use as confluence with other ICT concepts like FVGs and Order Blocks
Strategic Applications:
- Range trading between midnight levels
- Breakout confirmation when price closes decisively outside the range
- Support/resistance validation for entry and exit planning
🔗 Combine With These Tools for Complete Market Structure Analysis:
✅ First FVG — Opening Range Fair Value Gap Detector.
✅ ICT Turtle Soup (Liquidity Reversal)— Spot stop hunts and false breakout scenarios
✅ ICT Macro Zones (Grey Box Version)- It tracks real-time highs and lows for each Silver Bullet session
✅ ICT SMC Liquidity Grabs and OBs- Liquidity Grabs, Order Block Zones, and Fibonacci OTE Levels, allowing traders to identify institutional entry models with clean, rule-based visual signals.
Together, these tools create a comprehensive Smart Money Concepts (SMC) framework — helping traders identify, anticipate, and capitalize on institutional-level price movements with precision and confidence during critical overnight sessions.

Apex Edge - RSI Trend LinesThe Apex Edge - RSI Trend Lines indicator is a precision tool that automatically draws real-time trendlines on the RSI oscillator using confirmed pivot highs and lows. These dynamic trendlines track RSI structure in motion, helping you anticipate breakout zones, reversals, and hidden divergences.
Every time a new pivot forms, the indicator automatically re-draws the RSI trendline between the two most recent pivots — giving you an always-current view of momentum structure. You’ll instantly see when RSI begins compressing or expanding, long before price reacts.
Key Features: • Dynamic RSI trendlines drawn from the last 2 pivots
• Auto re-draws in real-time as new pivots form
• Optional "Full Extend" or "Pivot Only" modes
• Slope color-coded: green = support, red = resistance
• Built-in dotted RSI levels (30/70 default)
• Alert conditions for RSI trendline breakout signals
• Ideal for spotting divergence, compression, and early SMC confluence
This is not your average RSI — it’s a fully reactive momentum edge overlay designed to give you clarity, structure, and timing from within the oscillator itself. Perfect for traders using Smart Money Concepts, divergence setups, or algorithmic trend tracking.
⚔️ Built for precision. Built for edge. Built for Apex.

Fractal Pullback Market StructureFractal Pullback Market Structure
Author: The_Forex_Steward
License: Mozilla Public License 2.0
The Fractal Pullback Market Structure indicator is a sophisticated price action tool designed to visualize internal structure shifts and break-of-structure (BoS) events with high accuracy. It leverages fractal pullback logic to identify market swing points and confirm whether a directional change has occurred.
This indicator detects swing highs and lows based on fractal behavior, drawing zigzag lines to connect these key pivot points. It classifies and labels each structural point as either a Higher High (HH), Higher Low (HL), Lower High (LH), or Lower Low (LL). Internal shifts are marked using triangle symbols on the chart, distinguishing bullish from bearish developments.
Break of Structure events are confirmed when price closes beyond the most recent swing high or low, and a horizontal line is drawn at the breakout level. This helps traders validate when a structural trend change is underway.
Users can configure the lookback period that defines the sensitivity of the pullback detection, as well as a timeframe multiplier to align the logic with higher timeframes such as 4H or Daily. There are visual customization settings for the zigzag lines and BoS markers, including color, width, and style (solid, dotted, or dashed).
Alerts are available for each key structural label—HH, HL, LH, LL—as well as for BoS events. These alerts are filtered through a selectable alert mode that separates signals by timeframe category: Low Timeframe (LTF), Medium Timeframe (MTF), and High Timeframe (HTF). Each mode allows the user to receive alerts only when relevant to their strategy.
This indicator excels in trend confirmation and reversal detection. Traders can use it to identify developing structure, validate internal shifts, and anticipate breakout continuation or rejection. It is particularly useful for Smart Money Concept (SMC) traders, swing traders, and those looking to refine entries and exits based on price structure rather than lagging indicators.
Visual clarity, adaptable timeframe logic, and precise structural event detection make this tool a valuable addition to any price action trader’s toolkit.

MP MTF LiquidityMP MTF Liquidity
Multi-Timeframe Liquidity Levels – Automatic High/Low Tracking
This indicator automatically tracks and draws liquidity levels (recent highs and lows) from up to 6 custom timeframes directly on your chart. It’s designed for advanced traders who want to visualize important swing points and liquidity pools across multiple timeframes—ideal for Smart Money Concepts (SMC), ICT, and price action trading.
Key Features:
Multi-Timeframe Support:
Select up to 6 different timeframes (ex: 1H, 4H, Daily, Weekly, etc.), each with separate color and visibility controls.
Real Liquidity (No Repaint):
Levels are only drawn from fully closed bars on each timeframe—no lines from currently forming candles, ensuring accuracy and no forward-looking bias.
Automatic Detection:
Highs and lows are detected automatically. Levels that get swept (price breaks through) are converted to dashed lines for easy visual distinction.
Customizable:
Choose line colors for highs/lows and set the maximum number of active levels per timeframe to keep charts clean.
Extended Lines:
All levels are extended to the right, helping you see how current price interacts with past liquidity.
How It Works:
On every new bar of your chosen higher timeframe(s), the indicator records the high and low of the previous (just-closed) candle.
These levels are extended as rays until price sweeps (crosses) them.
When a level is swept, it is redrawn as a dashed line to highlight liquidity grabs or stop hunts.
No lines are drawn for the “live” bar—only confirmed, closed levels are displayed.
Who is this for?
SMC, ICT, and price action traders seeking high-confidence liquidity zones.
Intraday, swing, and multi-timeframe traders who want an automated, visual edge.
Anyone wanting to avoid repainting or “fake” levels from unfinished candles.
Tip:
Combine this indicator with your favorite order block, fair value gap (FVG), or market structure tools for even greater context and confluence.
Disclaimer:
No indicator guarantees profits. Always use with proper risk management and in conjunction with your trading plan.

Checklist Dashboard Table# Checklist Dashboard Table – ICT/SMC Trading Helper
Overview
The “Checklist Dashboard Table” is a TradingView indicator designed to help traders structure, organize, and validate their market analyses following the ICT/SMC (Inner Circle Trader / Smart Money Concepts) methodology. It provides a visual and interactive checklist directly on your chart, ensuring you never miss a crucial step in your decision-making process.
Key Features
- Visual Checklist : All your trading criteria are displayed as color-coded checkboxes (green for validated, red for not validated), making your analysis process both clear and efficient.
- Clear Separation Between Analysis and Confirmations :
- Analysis : Reminders for your routine, such as timeframe selection (M3 to H4), trend analysis via RSI, and identification of key zones (Midnight Open, SSL/BSL, Asian High/Low).
- Confirmations : Six customizable criteria to check off as you validate your setup (clear trend, OB + FVG, OTE zone, Premium/Discount, R/R > 1:2, CBDR/Midnight).
- Personal Notes Section : Keep your trade entries, observations, or comments in a dedicated field in the indicator’s settings. Your notes are displayed right in the checklist for quick reference and journaling.
- Elegant and Compact Display : The table is styled for readability and can be positioned anywhere on your chart.
- Quick Customization : Instantly update any criterion or your personal notes via the script settings.
How to Use
1. Add the indicator to your chart.
2. Review the “Analysis” section as your pre-trade routine reminder.
3. Check off the “Confirmations” criteria as you validate your entry strategy.
4. Write your trade notes or comments in the provided notes section.
5. Use the checklist to reinforce discipline and repeatability in your trading.
Why Use This Checklist?
- Prevents you from skipping important steps in your analysis.
- Reinforces trading discipline and consistency.
- Allows you to document and review your trade decisions for ongoing improvement.
Who Is It For?
Perfect for ICT/SMC traders, but also valuable for anyone looking to organize and systematize their trading process.
Happy trading!

Alt Szn Oracle - Institutional GradeThe Alt Szn Oracle is a macro-level indicator built to help traders front-run altseason by tracking liquidity, dominance rotation, sentiment, and capital flows—all in one signal. It’s designed for those who don’t just chase pumps, but want to understand when the tide is turning and why. This tool doesn't predict specific coin breakouts—it tells you when the market as a whole is gearing up to rotate into higher beta assets like altcoins, including memes and microcaps.
The index consolidates ten macro inputs into a normalized, smoothed score from 0–100. These include Bitcoin and Ethereum dominance, ETH/BTC, altcoin market cap (Total3), relative volume flows, and stablecoin supply (USDT, USDC, DAI)—which act as proxies for risk-on appetite and dry powder entering the system. It also incorporates manually updated sentiment metrics from Google Trends and the Fear & Greed Index, giving it a behavioral edge that most indicators lack.
The logic is simple but powerful: when BTC dominance is falling, ETH/BTC is rising, altcoin volume increases relative to BTC/ETH, and stablecoins start moving—you're likely in the early innings of rotation. The index is also filtered through a volatility threshold and smoothed with an EMA to eliminate chop and fakeouts.
Use this indicator on macro charts like TOTAL3, TOTAL2, or ETHBTC to gauge market health, or overlay it on specific coins like PEPE, DOGE, or SOL to confirm if the tide is in your favor. Interpreting the score is straightforward: readings above 80 suggest euphoria and signal it’s time to de-risk, 60–80 indicates expansion and confirms altseason is underway, 40–60 is neutral, and 20–40 is a capitulation zone where smart money accumulates.
What sets this apart is that it doesn’t just track price—it reflects the flow of capital, the positioning of liquidity, and the sentiment of the crowd. Most altseason indicators are lagging, overfitted, or too simplistic. This one is modular, forward-looking, and grounded in real capital rotation theory.
If you're a trader who wants to time the cycle, not guess it, this is your tool. Refine it, fork it, or expand it to your niche—DeFi, NFTs, meme coins, or L1s. It’s a framework for reading the macro winds, not a signal service. Use it with discipline, and you’ll catch the wave while others drown in noise.

Absorption DetectorABSORPTION DETECTOR -
The Absorption Detector identifies institutional order flow by detecting "absorption" patterns where smart money quietly accumulates or distributes positions by absorbing retail order flow. This creates high-probability support and resistance zones for trading. This is an approximation only and does not read any footprint data.
WHAT IS ABSORPTION?
Absorption occurs when institutions take the opposite side of retail trades, creating specific candlestick patterns with high volume and significant wicks. The indicator identifies two main patterns:
SELLING ABSORPTION (P-Pattern): Red zones above candles where institutions sell into retail buying pressure, creating resistance levels. Look for high volume candles with large upper wicks that close in the lower half.
BUYING ABSORPTION (B-Pattern): Green zones below candles where institutions buy from retail selling pressure, creating support levels. Look for high volume candles with large lower wicks that close in the upper half.
KEY FEATURES
- Automatic detection of institutional absorption patterns
- Dynamic support and resistance zone creation
- Customizable styling for all visual elements
- Historic zone display for backtesting analysis
- Strength-based filtering to show only high-probability setups
- Real-time alerts for new absorption patterns
- Professional info panel with key statistics
- Multi-timeframe compatibility
MAIN SETTINGS
Volume Threshold (1.2): Minimum volume surge required compared to average. Higher values = fewer but stronger signals.
Minimum Volume (2500): Absolute volume floor to prevent signals during low-volume periods.
Min Wick Size (0.2): Minimum wick size as ATR multiple. Ensures significant rejection occurred.
Minimum Strength (1.5): Combined volume and wick strength filter. Higher values = higher quality signals.
Show Historic Zones (OFF): Enable to see all historical zones for backtesting. Disable for better performance.
Zone Extension (20): How many bars to project zones forward for anticipating future reactions.
TRADING APPROACH
ZONE REACTION STRATEGY: Wait for price to approach absorption zones and trade the bounce or rejection. Use the zones as dynamic support and resistance levels.
BREAKOUT STRATEGY: Trade decisive breaks of strong absorption zones with proper risk management. Failed zones often lead to strong moves.
CONFLUENCE TRADING: Combine absorption zones with other technical analysis for highest probability setups. Look for alignment with trend lines, Fibonacci levels, and key support/resistance.
RISK MANAGEMENT: Always use stop losses beyond the absorption zones. Target minimum 1:2 risk-reward ratios. Position size appropriately based on zone strength.
OPTIMIZATION GUIDE
For Conservative Trading (fewer, higher quality signals):
- Volume Threshold: 1.5
- Minimum Strength: 2.0
- Min Wick Size: 0.3
For Aggressive Trading (more signals, requires careful filtering):
- Volume Threshold: 1.1
- Minimum Strength: 1.0
- Min Wick Size: 0.15
BEST PRACTICES
Markets: Works best on liquid instruments with good volume - major forex pairs, popular stocks, liquid futures, and established cryptocurrencies.
Timeframes: Effective on all timeframes from 1-minute scalping to daily swing trading. Adjust settings based on your timeframe and trading style.
Confirmation: Never trade absorption signals in isolation. Always combine with trend analysis, market structure, and proper risk management.
Session Timing: Be aware of market sessions and avoid trading during low liquidity periods or major news events.
Backtesting: Use the historic zones feature to validate performance on your chosen market and timeframe before live trading.
CUSTOMIZATION
The indicator offers complete visual customization including zone colors, border styles, label appearances, and info panel positioning. All colors can be adapted to match your chart theme and personal preferences.
Alert system provides both basic and custom message alerts for real-time notifications of new absorption patterns.
PERFORMANCE NOTES
Default settings are optimized for most markets and timeframes. For best performance on older charts, keep "Show Historic Zones" disabled unless specifically backtesting.
The indicator maintains excellent performance even with extensive historical analysis enabled, handling up to 500 zones and 100 labels for comprehensive backtesting.

First FVG📘 Indicator Description (English)
First FVG – NY Open is a TradingView indicator designed to automatically identify the first Fair Value Gap (FVG) that appears during the New York session, following the ICT (Inner Circle Trader) methodology.
It highlights institutional inefficiencies in price caused by imbalanced price action and helps traders spot high-probability entry zones, especially after the 9:30 AM EST (New York Open).
⚙️ How It Works
Session time: The indicator scans for FVGs starting at 9:32 AM (allowing 3 candles after the NY Open to form).
FVG Conditions:
Bullish FVG: When the high of 2 candles ago is lower than the low of the current candle and the middle candle is bullish.
Bearish FVG: When the low of 2 candles ago is higher than the high of the current candle and the middle candle is bearish.
Only the first FVG per session is drawn, as taught by ICT for setups like Judas Swing or NY Reversal models.
A colored box is drawn to represent the FVG zone.
A dotted horizontal line (CE) is drawn at the midpoint of the FVG box (Consequent Encroachment), a key level watched by smart money traders.
A dashed vertical line is drawn at 9:30 NY time to mark the open.
🧠 How to Use It
Wait for the NY Open (9:30 AM EST) – the indicator becomes active at 9:32 AM.
Watch for the first FVG box of the day. This is often a high-probability reaction zone.
Use the CE line (center of the FVG) as a reference for entries, rejections, or liquidity grabs.
Combine with market structure, PD Arrays, and liquidity concepts as taught by ICT for confluence.
The FVG box and CE line will extend forward for several candles for visual clarity.
🎛️ Customizable Settings
Session time (default: 09:32–16:00 NY)
FVG box color (up/down)
Text color
Max number of days to keep boxes on chart
Option to show or hide the 9:30 NY Open vertical line

Delta Spike Detector [GSK-VIZAG-AP-INDIA]📌 Delta Spike Detector – Volume Imbalance Ratio
By GSK-VIZAG-AP-INDIA
📘 Overview
This indicator highlights aggressive buying or selling activity by analyzing the imbalance between estimated Buy and Sell volume per candle. It flags moments when one side dominates the other significantly — defined by user-selectable volume ratio thresholds (10x, 15x, 20x, 25x).
📊 How It Works
Buy/Sell Volume Estimation
Approximates buyer and seller participation using candle structure:
Buy Volume = Proximity of close to low
Sell Volume = Proximity of close to high
Delta & Delta Ratio
Delta = Buy Volume − Sell Volume
Delta Ratio = Ratio of dominant volume side to the weaker side
When this ratio exceeds a threshold, it’s classified as a spike.
Spike Labels
Labels are plotted on the chart:
10x B, 15x B, 20x B, 25x B → Buy Spike Labels (below candles)
10x S, 15x S, 20x S, 25x S → Sell Spike Labels (above candles)
The color of each label reflects the spike strength.
⚙️ User Inputs
Enable/Disable Buy or Sell Spikes
Set custom delta ratio thresholds (default: 10x, 15x, 20x, 25x)
🎯 Use Cases
Spotting sudden aggressive activity (e.g. smart money moves, traps, breakouts)
Identifying short-term market exhaustion or momentum bursts
Complementing other trend or volume-based tools
⚠️ Important Notes
The script uses approximated Buy/Sell Volume based on price position, not actual order flow.
This is not a buy/sell signal generator. It should be used in context with other confirmation indicators or market structure.
✍️ Credits
Developed by GSK-VIZAG-AP-INDIA
For educational and research use only.

True Breakout Pattern [TradingFinder] Breakout Signal Indicator🔵 Introduction
In many market conditions, what initially appears to be a decisive breakout often turns out to be nothing more than a false breakout or fake breakout. Price breaks through a key swing level or an important support and resistance zone, only to quickly return to its previous range.
These failed breakouts, which are often the result of liquidity traps or market manipulation, serve more as a warning sign of structural weakness than confirmation of a new trend.
This indicator is designed around the concept of the fake breakout.
The logic is simple but precise : when price breaks a swing level and returns to that level within a maximum of five candles, the move is considered a false breakout. At this point, a Fibonacci retracement is applied to the recent price swing to evaluate the pullback area.
If price, within ten candles after the return to the breakout level, enters the Fibonacci zone between 0.618 and 1.0, the setup becomes valid for a potential entry. This area is identified as a long entry zone, with the stop loss placed just beyond the 1.0 level and the take profit defined based on the desired risk-to-reward ratio.
By combining accurate detection of false breakouts, analysis of price reaction to swing levels, and alignment with Fibonacci retracement logic, this framework allows traders to identify opportunities often missed by others. In a market where failed breakouts are a common and recurring phenomenon, this indicator aims to transform these traps into measurable trading opportunities.
Long Setup :
Short Setup :
🔵 How to Use
This indicator operates based on the recognition of false breakouts from structural levels in the market, specifically swing levels, and combines that with Fibonacci retracement analysis.
In this strategy, trades are only considered when price returns to the broken level within a defined time window and reacts appropriately inside a predefined Fibonacci range. Depending on the direction of the initial breakout, the system outlines two scenarios for long and short setups.
🟣 Long Setup
In the long setup, price initially breaks below a support level or swing low. If the price returns to the broken level within a maximum of five candles, the move is identified as a fake breakout.
At this stage, a Fibonacci retracement is drawn from the recent high to the low. If price, within ten candles of returning to the level, moves into the 0.618 to 1.0 Fibonacci zone, the conditions for a long entry are met.
The stop loss is placed slightly below the 1.0 level, while the take profit is set based on the trader’s preferred risk-reward ratio. This setup aims to capture deeply discounted entries at low risk, aligned with smart money reversals.
🟣 Short Setup
In the short setup, the price breaks above a resistance level or swing high. If the price returns to that level within five candles, the move is again treated as a false breakout. Fibonacci is then drawn from the recent low to the high to observe the retracement area.
Should price enter the 0.618 to 1.0 Fibonacci range within ten candles of returning, a short entry is considered valid. In this case, the stop loss is placed just above the 1.0 level, and the take profit is adjusted based on the intended risk-reward target. This method allows traders to identify high-probability short setups by focusing on failed breakouts and deep pullbacks.
🔵 Settings
🟣 Logical settings
Swing period : You can set the swing detection period.
Valid After Trigger Bars : Limits how many candles after a fake breakout the entry zone remains valid.
Max Swing Back Method : It is in two modes "All" and "Custom". If it is in "All" mode, it will check all swings, and if it is in "Custom" mode, it will check the swings to the extent you determine.
Max Swing Back : You can set the number of swings that will go back for checking.
🟣 Display settings
Displaying or not displaying swings and setting the color of labels and lines.
🟣 Alert Settings
Alert False Breakout : Enables alerts for Breakout.
Message Frequency : Determines the frequency of alerts. Options include 'All' (every function call), 'Once Per Bar' (first call within the bar), and 'Once Per Bar Close' (final script execution of the real-time bar). Default is 'Once per Bar'.
Show Alert Time by Time Zone : Configures the time zone for alert messages. Default is 'UTC'.
🔵 Conclusion
A sound understanding of the false breakout phenomenon and its relationship to structural price behavior is essential for technical traders aiming to improve precision and consistency. Many poor trading decisions stem from misinterpreting failed breakouts and entering too early into weak signals.
A structured approach, grounded in the analysis of swing levels and validated through specific price action and timing rules, can turn these misleading moves into valuable trade opportunities.
This indicator, by combining fake breakout detection with time filters and Fibonacci-based retracement zones, helps traders only engage with the market when multiple confirming factors are in alignment. The result is a strategy that emphasizes probability, risk control, and clarity in decision-making, offering a solid edge in navigating today’s volatile markets.

Swing High/Low with Liquidity Sweeps🧠 Overview
This indicator identifies swing highs and swing lows based on user-defined candle lengths and checks for liquidity sweeps—situations where the price breaks a previous swing level but then closes back inside, indicating a potential false breakout or stop hunt. It also supports visual labeling and alerts for these events.
⚙️ Inputs
Swing Length (must be odd number ≥ 3):
Determines how many candles are used to identify swing highs/lows. The central candle must be higher or lower than all neighbors within the range.
Example: If swingLength = 5, the central candle must be higher/lower than the 2 candles on both sides.
Sweep Lookback (bars):
Defines how many bars to look back for possible liquidity sweeps.
Show Swing Labels (checkbox):
Optionally display labels on the chart when a swing high or low is detected.
Show Sweep Labels (checkbox):
Optionally display labels on the chart when a liquidity sweep occurs.
🕯️ Swing Detection Logic
A Swing High is detected when the high of the central candle is greater than the highs of all candles around it (as per the defined length).
A Swing Low is detected when the low of the central candle is lower than the lows of surrounding candles.
Swing labels are placed slightly above (for highs) or below (for lows) the candle.
💧 Liquidity Sweep Logic
A Sweep High is triggered if:
The current high breaks above a previously detected swing high,
And then the candle closes below that swing high,
Within the configured lookback window.
A Sweep Low is triggered if:
The current low breaks below a previous swing low,
And then closes above it,
Within the lookback window.
These are often seen as stop hunts or fake breakouts.
🔔 Alerts
Sweep High Alert: Triggered when a sweep above a swing high occurs.
Sweep Low Alert: Triggered when a sweep below a swing low occurs.
You can use these to set up TradingView alerts to notify you of potential liquidity grabs.
📊 Use Cases
Identifying market structure shifts.
Spotting fake breakouts and potential reversals.
Assisting in smart money concepts and liquidity-based trading.
Supporting entry timing in trend continuation or reversal strategies.

F&O Time Zones – Final Fixed📌 This indicator highlights high-probability intraday time zones used in Indian F&O (Futures & Options) strategies. Ideal for scalping, breakout setups, and trap avoidance.
🕒 Covered Time Zones:
• 9:15 – 9:21 AM → Flash Trades (first 1-minute volatility)
• 9:21 – 9:30 AM → Smart Money Trap (VWAP fakeouts)
• 9:30 – 9:50 AM → Fake Breakout Zone
• 9:50 – 10:15 AM → Institutional Entry Timing
• 10:15 – 10:45 AM → VWAP Range Scalps
• 10:45 – 11:15 AM → Second Trap Zone
• 11:15 – 1:00 PM → Trend Continuation Window
• 1:00 – 1:45 PM → Volatility Compression
• 1:45 – 2:15 PM → Institutional Exit Phase 1
• 2:15 – 2:45 PM → Trend Acceleration / Reversals
• 2:45 – 3:15 PM → Expiry Scalping Zone
• 3:15 – 3:30 PM → Dead Zone (square-off time)
🔧 Features:
✓ Clean vertical lines per zone
✓ Optional label positions (top or bottom)
✓ Adjustable line style, width, and color
🧠 Best used on: NIFTY, BANKNIFTY, FINNIFTY (5-min or lower)
---
🔒 **Disclaimer**:
This script is for **educational purposes only**. It is not financial advice. Trading involves risk. Please consult a professional or do your own research before taking any positions.
—
👤 Script by: **JoanJagan**
🛠️ Built in Pine Script v5

Market Shift Levels [ChartPrime]Market Shift Levels
This indicator detects trend shifts and visualizes key market structure turning points using Hull Moving Average logic. It highlights potential areas of support and resistance where price is likely to react, empowering traders to spot early trend transitions.
Market Shift Levels are horizontal zones that mark the moment of a directional change in market behavior. These shifts are based on crossovers between two smoothed Hull Moving Averages (HMA), allowing the indicator to detect potential reversals with minimal lag.
Once a shift is detected:
A dashed horizontal Market Shift Level is plotted at the low (for bullish shift) or high (for bearish shift) of the candle.
These levels often become key reaction points during pullbacks and trend retests.
Volume or price labels are added when price wicks into these levels, helping traders gauge the strength of rejection or acceptance.
⯁ KEY FEATURES
Uses HMA-based logic to detect when price momentum shifts.
Plots clean Market Shift Levels (MSLs) that act as dynamic support and resistance.
Automatically colors bars and candles based on the price positioning relative to levels.
Labels wick-based retests with either:
Volume data of the 3-bar cluster (default).
Price level if toggled.
⯁ HOW TO USE
Look for trend shifts where the HMA crossover triggers a new level — this marks a possible structural pivot .
Use the horizontal level as a dynamic support or resistance zone — especially when price returns with wick rejections.
Watch for volume labels near the level — higher values signal stronger rejection and potential continuation.
Combine with confluence tools like Smart Money concepts or Fibonacci levels for added edge.
⯁ EXAMPLE SETUPS
After a bullish shift, wait for price to return and wick into the level — if volume spikes and candle closes strong, it’s a retest confirmation entry .
After a bearish shift, bearish wick rejections with volume may signal short re-entry zones .
⯁ CONCLUSION
The Market Shift Levels indicator offers a visual and data-backed approach to spotting trend reversals and critical retest zones. It’s a simple yet powerful tool to structure your trades around objective, repeatable market behavior — all in real-time.

Volume Overbought/Oversold Zones📊 What You’ll See on the Chart
Red Background or Red Triangle ABOVE a Candle
🔺 Means: Overbought Volume
→ Volume on that bar is much higher than average (as defined by your settings).
→ Suggests strong activity, possible exhaustion in the trend or an emotional spike.
→ It’s a warning: consider watching for signs of reversal, especially if price is already stretched.
Green Background or Green Triangle BELOW a Candle
🔻 Means: Oversold Volume
→ Volume on that bar is much lower than normal.
→ Suggests the market may be losing momentum, or few sellers are left.
→ Could signal an upcoming reversal or recovery if confirmed by price action.
Orange Line Below the Candles (Volume Moving Average)
📈 Shows the "normal" average volume over the last X candles (default is 20).
→ Helps you visually compare each bar’s volume to the average.
Gray Columns (Actual Volume Bars)
📊 These are your regular volume bars — they rise and fall based on how active each candle is.
🔍 What This Indicator Does (In Simple Words)
This indicator looks at trading volume—which is how many shares/contracts were traded in a given period—and compares it to what's considered "normal" for recent history. When volume is unusually high or low, it highlights those moments on the chart.
It tells you:
• When volume is much higher than normal → market might be overheated or experiencing a buying/selling frenzy.
• When volume is much lower than normal → market might be quiet, potentially indicating lack of interest or indecision.
These conditions are marked visually, so you can instantly spot them.
💡 How It Helps You As a Trader
1. Spotting Exhaustion in Trends (Overbought Signals)
If a market is going up and suddenly volume spikes way above normal, it may mean:
• The move is getting crowded (lots of buyers are already in).
• A reversal or pullback could be near because smart money may be taking profits.
Trading idea: Wait for high-volume up bars, then look for price weakness to consider a short or exit.
2. Identifying Hidden Opportunities (Oversold Signals)
If price is falling but volume drops unusually low, it might mean:
• Panic is fading.
• Sellers are losing energy.
• A bounce or trend reversal could happen soon.
Trading idea: After a volume drop in a downtrend, watch for bullish price patterns or momentum shifts to consider a buy.
3. Confirming or Doubting Breakouts
Volume is critical for confirming breakouts:
• If price breaks a key level with strong volume, it's more likely to continue.
• A breakout without volume could be a fake-out.
This indicator highlights volume surges that can help you confirm such moves.
📈 How to Use It in Practice
• Combine it with candlestick patterns, support/resistance, or momentum indicators.
• Use the background colors or shapes as a visual cue to pause and analyze.
• Adjust the sensitivity to suit fast-moving markets (like crypto) or slow ones (like large-cap stocks).

ICT IRL & ERL ZonesICT IRL & ERL Zones
This indicator visualizes Internal Range Liquidity (IRL) and External Range Liquidity (ERL) levels, based on ICT (Inner Circle Trader) concepts. It's designed to help traders identify key liquidity zones that often act as magnet levels or reversal points in price action.
🔍 How It Works
Lookback Range: The script analyzes the highest high and lowest low over a user-defined number of candles (default: 50).
IRL (Internal Range Liquidity):
Plots the highest high and lowest low within the lookback period.
Represented as orange lines and a shaded zone.
ERL (External Range Liquidity):
Extends the IRL boundaries by a small buffer (50 ticks above/below).
Visualizes zones where price may reach for liquidity beyond the current range.
Plotted as a green (high) and red (low) line.
⚙️ Inputs
Lookback Range: Number of candles to calculate the range (min 5).
Show IRL: Toggle visibility for Internal Range Liquidity zone.
Show ERL: Toggle visibility for External Range Liquidity buffer zone.
📊 Visual Elements
IRL High/Low: Orange lines with fill to mark the main liquidity range.
ERL High/Low: Green and red lines indicating potential liquidity sweep zones.
Zone Fill: Light orange shading to visually emphasize the IRL area.
📈 Use Case
Use this tool to:
Identify areas where price might consolidate or reverse.
Highlight likely zones of liquidity grabs before trend continuations or shifts.
Enhance entry/exit decisions based on smart money concepts.

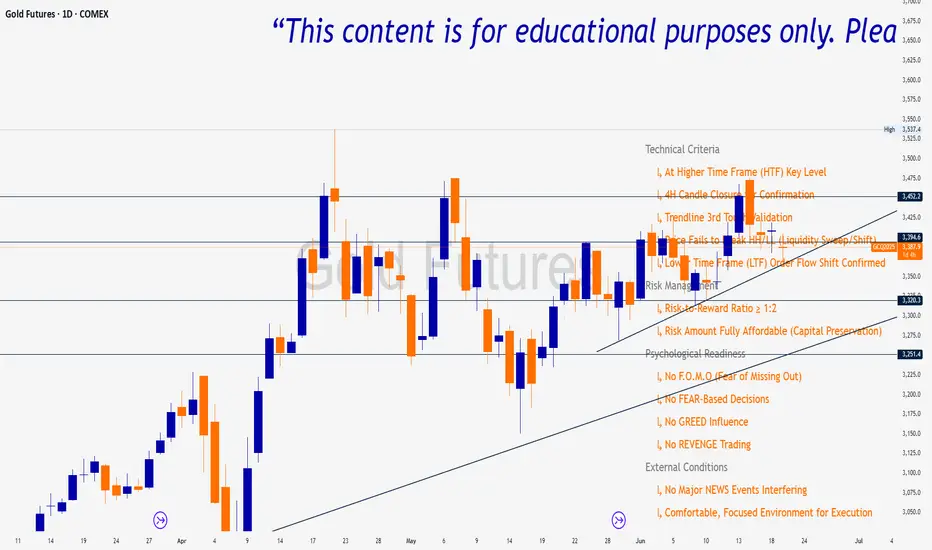
Trade Insight Entry Check List📌 Trade Insight™ Entry Checklist Indicator
This indicator is designed for Smart Money Concepts (SMC) and Price Action traders who prioritize precision, patience, and psychological discipline.
It helps you validate your trade setup across four essential categories before execution:
🔍 Technical Criteria
✅ Higher Time Frame (HTF) Key Level respected
✅ 4H Candle Closure Confirmation
✅ Trendline 3rd Touch Validation
✅ Liquidity Sweep or Shift (price fails to break HH/LL)
✅ Lower Time Frame (LTF) Order Flow Shift Confirmed
💰 Risk Management
✅ Risk-to-Reward Ratio ≥ 1:2
✅ Risk Amount Fully Affordable (Capital Preservation mindset)
🧠 Psychological Readiness
✅ No F.O.M.O (Fear of Missing Out)
✅ No FEAR-based decisions
✅ No GREED influence
✅ No REVENGE trading
Mark4ex vWapMark4ex VWAP is a precision session-anchored Volume Weighted Average Price (VWAP) indicator crafted for intraday traders who want clean, reliable VWAP levels that reset daily to match a specific market session.
Unlike the built-in continuous VWAP, this version anchors each day to your chosen session start and end time, most commonly aligned with the New York Stock Exchange Open (9:30 AM EST) through the market close (4:00 PM EST). This ensures your VWAP reflects only intraday price action within your active trading window — filtering out irrelevant overnight moves and providing clearer mean-reversion signals.
Key Features:
Fully configurable session start & end times — adapt it for NY session or any other market.
Anchored VWAP resets daily for true session-based levels.
Built for the New York Open Range Breakout strategy: see how price interacts with VWAP during the volatile first 30–60 minutes of the US market.
Plots a clean, dynamic line that updates tick-by-tick during the session and disappears outside trading hours.
Designed to help you spot real-time support/resistance, intraday fair value zones, and liquidity magnets used by institutional traders.
How to Use — NY Open Range Breakout:
During the first hour of the New York session, institutional traders often define an “Opening Range” — the high and low formed shortly after the bell. The VWAP in this zone acts as a dynamic pivot point:
When price is above the session VWAP, bulls are in control — the level acts as a support floor for pullbacks.
When price is below the session VWAP, bears dominate — the level acts as resistance against bounces.
Breakouts from the opening range often test the VWAP for confirmation or rejection.
Traders use this to time entries for breakouts, retests, or mean-reversion scalps with greater confidence.
⚙️ Recommended Settings:
Default: 9:30 AM to 4:00 PM New York time — standard US equities session.
Adjust hours/minutes to match your target market’s open and close.
👤 Who is it for?
Scalpers, day traders, prop traders, and anyone trading the NY Open, indices like the S&P 500, or highly liquid stocks during US cash hours.
🚀 Why use Mark4ex VWAP?
Because a properly anchored VWAP is a trader’s real-time institutional fair value, giving you better context than static moving averages. It adapts live to volume shifts and helps you follow smart money footprints.
This indicator will reconfigure every day, anchored to the New York Open, it will also leave historical NY Open VWAP for study purpose.
SMT DivergenceSMT Divergence Indicator
This powerful indicator identifies high-probability reversal points by detecting SMT (Smart Money Technique) divergences between two correlated assets. It spots subtle shifts in market momentum, revealing when one asset fails to confirm the price action of another—often signaling an impending trend change.
Key Features:
Inter-Market Divergence Detection: Automatically compares the price action of the main symbol with a second user-defined asset.
Identifies Key Reversals: Pinpoints both bullish and bearish SMT divergences, highlighting hidden strength in downtrends and underlying weakness in uptrends.
Customizable Pivot Detection: Allows fine-tuning of the pivot length to adjust sensitivity for different market conditions and timeframes.
Flexible Display Modes: Choose between clean 'Lines' connecting the diverging pivots or precise 'Labels' marking the exact high/low points.
Full Visual Customization: Complete control over the colors and line thickness for seamless integration with your existing chart layout.
Built-in Alerts: Stay notified of every potential opportunity with alerts for both bullish and bearish signals.
Settings:
Core Parameters:
Comparison Symbol: Select the second asset to compare against for divergence analysis (e.g., NQ1! if you are charting ES1!).
Pivot Length: Defines the number of bars to the left and right required to confirm a pivot high or low.
Visual Settings:
Display Style: Choose to visualize divergences as 'Lines' or 'Labels'.
Bearish/Bullish Color: Set custom colors for bearish and bullish divergence indicators.
Line Width: Adjust the thickness of the divergence lines for optimal visibility.
Perfect for traders who utilize inter-market analysis to confirm trade ideas. The SMT Divergence indicator provides a crucial edge by exposing non-confirmations between related assets, allowing for earlier and more confident entries into potential market reversals.

Candle Range Detector by TradeTech AnalysisCandle Range Detector by TradeTech Analysis
This advanced indicator identifies and visualizes price compression zones based on inside bar formations, then tracks how price behaves around those zones — offering valuable insights into liquidity sweeps, range expansions, and trap/mitigation behavior.
The script builds upon the foundational concept of range-based price action, commonly used by institutional traders, and adds automation, mitigation tracking, and sweep detection to map how price reacts around these critical ranges.
🔍 How It Works:
• Range Formation: A new range is detected when the current candle forms entirely within the high and low of the previous candle (i.e., an inside bar). This behavior often indicates price compression and potential breakout zones.
• Range Extension: Once a range is confirmed, the script projects upper and lower boundaries (using either a percentage-based multiplier or Fibonacci log extension), providing context for expected breakout zones.
• Mitigation Tracking: The script continuously monitors whether price breaks above or below the projected extensions, marking that range as mitigated — useful for confirming whether liquidity was absorbed.
• Sweep Detection: If price re-visits a mitigated zone and shows signs of a liquidity sweep (via wick + close behavior), the indicator triggers visual sweep labels and optional alerts.
🧠 Optional Visual Enhancements:
• Highlight range-forming candles with light blue background (toggle on/off)
• Midpoint dotted line for symmetry analysis
• Labels for “Range High” and “Range Low” for visual clarity
• Dynamic box drawing that adapts upon mitigation or continuation
⚙️ Customizable Features:
• Choose between Normal and Fibonacci-based detection modes
• Toggle visibility of range boxes, extension lines, and sweep markers
• Configure sweep alerts, mitigation window size, and visual transparency
⸻
🧪 Use Cases
• Identify consolidation zones before major price moves
• Confirm liquidity sweeps for entry/exit traps
• Visualize and test mitigation behavior of past zones
• Combine with Order Flow or Volume Profile tools to enhance context
⸻
⚠️ This is a fully original implementation that goes beyond classical inside-bar scanners by incorporating mitigation, extension projection, and liquidity sweeps — making it a powerful tool for intraday, swing, and even Smart Money-based trading setups.

S&P Power Hour Liquidity Sweep StrategyThis indicator is designed for intraday traders who want to take advantage of liquidity grabs, break of structure (BOS), and optimal entry points during the most volatile hours of the trading day: the NYSE Power Hours (09:30–10:30 AM and 02:30–04:00 PM EST).
Key Features:
Power Hour Detection:
Automatically identifies the two most liquid hours of the trading session.
Liquidity Sweep Detection:
Highlights when price sweeps a recent swing high or low — a common trap before reversals.
Break of Structure (BOS):
Confirms trend shift after a liquidity sweep with smart money-style BOS markers.
Fair Value Gap (FVG) Highlighting: (Optional)
Spot institutional imbalances between candles to fine-tune trade entries.
How It Works:
Wait for price to sweep a swing high or low during the power hours.
Look for a break of structure (BOS) in the opposite direction.
Enter on the next candle or FVG retest.
The indicator will plot a yellow circle for entry, a red line for stop, and a green line for the target (based on your RR setting).
Customizable Inputs:
Swing sensitivity (lookback bars)
Risk-to-reward ratio
Optional FVG visibility
Best Used With:
Higher timeframe bias (15m/1H)
Order blocks or volume analysis
Avoiding major news events
Whether you're a scalper or precision-based intraday trader, this tool helps you spot high-probability reversal setups with clean visuals and clear confirmations.

Killzones [Plug&Play]Highlight the most important institutional trading hours with precision.
The Setup Agent Killzones indicator automatically plots vertical lines to mark the key “Killzone” windows each day — London (08:00–09:00) and New York (15:00–16:00), shown in UK time. These timeframes represent periods of high volatility, where smart money activity is most likely to create the day’s major moves.
How it works:
Instantly visualise the London and New York Killzones with subtle vertical lines.
Customise which sessions to show to fit your trading style.
Stay focused on the windows where market makers are most active.
Perfect for intraday traders and anyone using session-based strategies.
Combine with our session indicator for a complete Plug&Play edge.

Flux Capacitor (FC)# Flux Capacitor
**A volume-weighted, outlier-resistant momentum oscillator designed to expose hidden directional pressure from institutional participants.**
---
### Why "Flux Capacitor"?
The name pays homage to the fictional energy core in *Back to the Future* — an invisible engine that powers movement. Similarly, this indicator detects whether price movement is being powered by real market participation (volume) or if it's coasting without conviction.
---
### Methodology
The Flux Capacitor fuses three statistical layers:
- **Normalized Momentum**: `(Close – Open) / ATR`
Controls for raw price size and volatility.
- **Volume Scaling**:
Amplifies the effect of price moves that occur with elevated volume.
- **Robust Normalization**:
- *Winsorization* caps outlier spikes.
- *MAD-Z scoring* normalizes the signal across assets (crypto, futures, stocks).
- This produces consistent scaling across timeframes and symbols.
The result is a smooth oscillator that reliably indicates **liquidity-backed momentum** — not just price movement.
---
### Signal Events
- **Divergence (D)**: Price makes higher highs or lower lows, but Flux does not.
- **Absorption (A)**: Candle shows high volume and small body, while Flux opposes the candle direction — indicates smart money stepping in.
- **Compression (◆)**: High volume with low momentum — potential breakout zone.
- **Zero-Cross**: Indicates directional regime flip.
- **Flux Acceleration**: Histogram shows pressure rate of change.
- **Regime Background**: Color fades with weakening trend conviction.
All signals are color-coded and visually compact for easy pattern recognition.
---
### Interpreting Divergence & Absorption Correctly
Signal strength improves significantly when it appears **in the correct zone**:
#### Divergence:
| Signal | Zone | Meaning | Strength |
|--------|------------|------------------------------------------|--------------|
| Green D | Below 0 | Bullish reversal forming in weakness | **Strong** |
| Green D | Above 0 | Bullish, but less convincing | Moderate |
| Red D | Above 0 | Bearish reversal forming in strength | **Strong** |
| Red D | Below 0 | Bearish continuation — low warning value | Weak |
#### Absorption:
| Signal | Zone | Meaning | Strength |
|--------|------------|-----------------------------------------|--------------|
| Green A | Below 0 | Buyers absorbing panic-selling | **Strong** |
| Green A | Above 0 | Support continuation | Moderate |
| Red A | Above 0 | Sellers absorbing FOMO buying | **Strong** |
| Red A | Below 0 | Trend continuation — not actionable | Weak |
Look for **absorption or divergence signals in “enemy territory”** for the most actionable entries.
---
### Reducing Visual Footprint
If your chart shows a long line of numbers across the top of the Flux Capacitor pane (e.g. "FC 14 20 9 ... Bottom Right"), it’s due to TradingView’s *status line input display*.
**To fix this**:
Right-click the indicator pane → **Settings** → **Status Line** tab → uncheck “Show Indicator Arguments”.
This frees up vertical space so top-edge signals (like red `D` or yellow `◆`) remain visible and unobstructed.
---
### Features
- Original MAD-Z based momentum design
- True volume-based divergence and absorption logic
- Built-in alerts for all signal types
- Works across timeframes (1-min to weekly)
- Minimalist, responsive layout
- 25+ customizable parameters
- No future leaks, no repainting
---
### Usage Scenarios
- **Trend confirmation**: Flux > 0 confirms bullish trend strength
- **Reversal detection**: Divergence or absorption in opposite territory = high-probability reversal
- **Breakout anticipation**: Compression signal inside range often precedes directional move
- **Momentum shifts**: Watch for zero-crosses + flux acceleration spikes
---
### ⚠ Visual Note for BTC, ETH, Crude Oil & Futures
These high-priced or rapidly accelerating instruments can visually compress any linear oscillator. You may notice the Flux Capacitor’s line appears "flat" or muted on these assets — especially over long lookbacks.
> **This does not affect signal validity.** Divergence, absorption, and compression triggers still fire based on underlying logic — only the line’s amplitude appears reduced due to scaling constraints.
---
### Disclaimer
This indicator is for educational purposes only. It is not trading advice. Past results do not guarantee future performance. Use in combination with your own risk management and analysis.
